How to use Charts in Flutter with FL Chart
FL Chart is a library that allows you to create simple and animated charts in Flutter.
November 20, 2021
In this article, we are going to integrate charts in Flutter applications. We are using fl_chart package to add charts in Flutter applications.
Flutter Fl Chart Package
Fl Chart is a powerful Flutter chart library, currently supporting Line Chart, Bar Chart and Pie Chart.
Let's get started
To do that please open your pubspec.yaml file and add the blow dependency:
dependencies:
  fl_chart: ^0.40.5
After this, run ‘flutter packages get’ to add the package.
Line Chart Usage
To add line chart into your Flutter app use the code below and customize it
import 'package:fl_chart/fl_chart.dart';
....

LineChart(
  // chart options data
  mainData(),
  swapAnimationCurve: Curves.easeInOutCubic,
  swapAnimationDuration: Duration(milliseconds: 1000),
)
// monthly data
List<FlSpot> _monthlySpots = [
  FlSpot(0, 110.0),
  FlSpot(1, 110.0),
  FlSpot(2, 130.0),
  FlSpot(3, 100.0),
  FlSpot(4, 130.0),
  FlSpot(5, 160.0),
  FlSpot(6, 190.0),
  FlSpot(7, 150.0),
  FlSpot(8, 170.0),
  FlSpot(9, 180.0),
  FlSpot(10, 140.0),
  FlSpot(11, 150.0),
];

LineChartData mainData() {
  return LineChartData(
    borderData: FlBorderData(
      show: false, // to remove border around chart
    ),
    gridData: FlGridData(
      show: false, // to remove grids
      horizontalInterval: 1.6,
      drawVerticalLine: false // or just remove vertical lines
    ),
    titlesData: FlTitlesData(
      show: false, // for hide charts titles
      rightTitles: SideTitles(showTitles: false), // for hide right side titles
      topTitles: SideTitles(showTitles: false),
      bottomTitles: SideTitles( // customize bottom titles
        showTitles: false,
        reservedSize: 22,
        interval: 1,
        getTextStyles: (context, value) => const TextStyle(
          color: Color(0xff68737d),
          fontWeight: FontWeight.bold,
          fontSize: 8
        ),
        getTitles: (value) {
          switch (value.toInt()) {
            case 1:
              return 'JAN';
            case 2:
              return 'FEB';
            case 3:
              return 'MAR';
            case 4:
              return 'APR';
            case 5:
              return 'MAY';
            case 6:
              return 'JUN';
            case 7:
              return 'JUL';
            case 8:
              return 'AUG';
            case 9:
              return 'SEP';
            case 10:
              return 'OCT';
            case 11:
              return 'NOV';
            case 12:
              return 'DEC';
          }
          return '';
        },
        margin: 10,
      ),
      leftTitles: SideTitles( // customize left titles
        showTitles: false,
        interval: 1,
        getTextStyles: (context, value) => const TextStyle(
          color: Color(0xff67727d),
          fontWeight: FontWeight.bold,
          fontSize: 12,
        ),
        getTitles: (value) {
          switch (value.toInt()) {
            case 1:
              return '10k';
            case 3:
              return '30k';
            case 5:
              return '50k';
          }
          return '';
        },
      ),
    ),
    minX: 0,
    maxX: _monthlySpots.length.toDouble()
    minY: 0,
    maxY: 200,
    lineTouchData: LineTouchData(
      getTouchedSpotIndicator: (LineChartBarData barData, List<int> spotIndexes) {
        return spotIndexes.map((index) {
          return TouchedSpotIndicatorData(
            FlLine(
              color: Colors.white.withOpacity(0.1),
              strokeWidth: 2,
              dashArray: [3, 3],
            ),
            FlDotData(
              show: false,
              getDotPainter: (spot, percent, barData, index) =>
                FlDotCirclePainter(
                  radius: 8,
                  color: [
                    Colors.black,
                    Colors.black,
                  ][index],
                  strokeWidth: 2,
                  strokeColor: Colors.black,
                ),
            ),
          );
        }).toList();
      },
      enabled: true,
      touchTooltipData: LineTouchTooltipData( // customize tooltip
        tooltipPadding: const EdgeInsets.all(8),
        tooltipBgColor: Color(0xff2e3747).withOpacity(0.8),
        getTooltipItems: (touchedSpots) {
          return touchedSpots.map((touchedSpot) {
            return LineTooltipItem(
              '\$${touchedSpot.y.round()}.00',
              const TextStyle(color: Colors.white, fontSize: 12.0),

            );
          }).toList();
        },
      ),
      handleBuiltInTouches: true,
    ),
    lineBarsData: [
      LineChartBarData( // draw line chart
        spots: _monthlySpots,
        isCurved: true,
        colors: gradientColors,
        barWidth: 2,
        dotData: FlDotData(
          show: false,
        ),
        belowBarData: BarAreaData(
          show: true,
          gradientFrom: Offset(0, 0),
          gradientTo: Offset(0, 1),
          colors: [
            Colors.black.withOpacity(0.1),
            Colors.black.withOpacity(0),
          ]
        ),
      )
    ],
  );
}
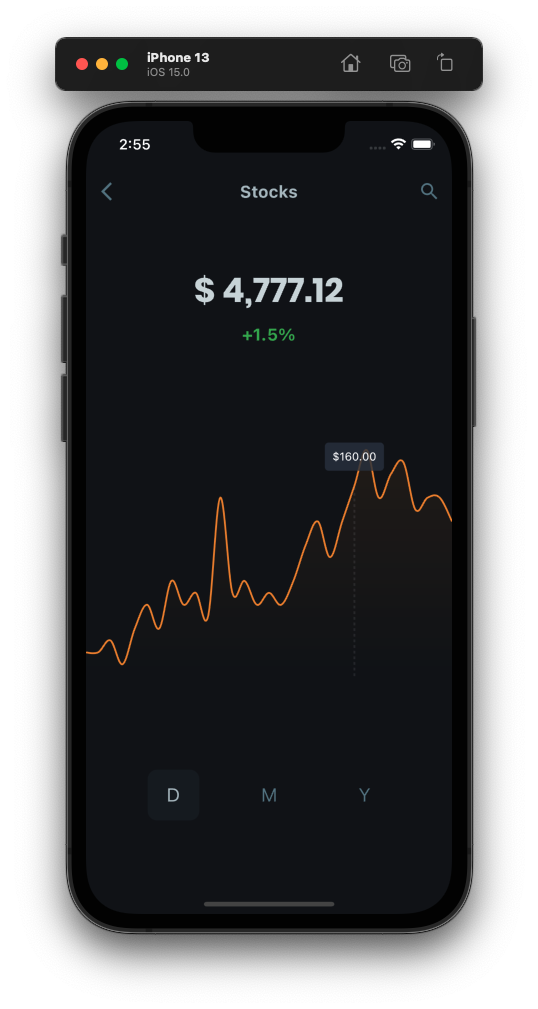
If you did everything right, you should have a chart like this


